After the economy righted itself in the wake of the pandemic and things seemed to be looking up in terms of unemployment rates and consumer spending, the U.S. entered a period of high inflation from which it hasn’t quite recovered.
As a result, some parts of the country may seem to be doing really well, while others are struggling. Though record high inflation has begun to level out some, an overall increase in cost of living has left a trace. Some states have already rebounded nearly to pre-pandemic levels, while others struggle to return to a state of balance.
To determine which economies are thriving and which are failing, GOBankingRates took a look at a variety of economic factors, from year-over-year GDP growth rate and unemployment rates to wage changes and the percentage of a state’s population that is living in poverty as of March 2024. States — including Washington D.C., which is not a state, but a sizable economy — were divided into the top 15 and the bottom 15 based on their economy health. Read on to find out which states are struggling and which ones are thriving.
Also see how even in an improving economy, Americans are still struggling.
Be Aware: I’m a Self-Made Millionaire: Here’s My 4-Step Payday Routine
Trending Now: 4 Genius Things All Wealthy People Do With Their Money


States Whose Economies Are Failing
These states are still struggling with economic challenges. Although overall unemployment trends are improving, residents of these states may still have trouble finding jobs and contributing to the state’s GDP.
Read More: 6 Reasons the Poor Stay Poor and Middle Class Doesn’t Become Wealthy
Explore Next: Here’s What the US Minimum Wage Was the Year You Were Born


Louisiana
-
March 2024 unemployment rate: 4.4%
-
GDP growth Q3 2023 to Q4 2023: 3.2%
-
Average weekly wages Q1 2023: $1,107
-
Percent of population below poverty line 2022: 18.7%
Be Aware: 7 Popular Clothing Brands the Middle Class Can’t Afford Anymore


Mississippi
-
March 2024 unemployment rate: 3%
-
GDP growth Q3 2023 to Q4 2023: 4.2%
-
Average weekly wages Q1 2023: $927
-
Percent of population below poverty line 2022: 19.2%


Illinois
-
March 2024 unemployment rate: 4.8%
-
GDP growth Q3 2023 to Q4 2023: 3.6%
-
Average weekly wages Q1 2023: $1,346
-
Percent of population below poverty line 2022: 11.8%


Arkansas
-
March 2024 unemployment rate: 3.5%
-
GDP growth Q3 2023 to Q4 2023: 3.1%
-
Average weekly wages Q1 2023: $1,036
-
Percent of population below poverty line 2022: 16.2%
Learn More: Here’s How Much the Definition of Rich Has Changed in Every State


Kentucky
-
March 2024 unemployment rate: 4.5%
-
GDP growth Q3 2023 to Q4 2023: 4.1%
-
Average weekly wages Q1 2023: $1,092
-
Percent of population below poverty line 2022: 16.1%


Michigan
-
March 2024 unemployment rate: 3.9%
-
GDP growth Q3 2023 to Q4 2023: 3.8%
-
Average weekly wages Q1 2023: $1,228
-
Percent of population below poverty line 2022: 13.1%


West Virginia
-
March 2024 unemployment rate: 4.3%
-
GDP growth Q3 2023 to Q4 2023: 5.9%
-
Average weekly wages Q1 2023: $1,044
-
Percent of population below poverty line 2022: 16.8%


Ohio
-
March 2024 unemployment rate: 3.8%
-
GDP growth Q3 2023 to Q4 2023: 4.3%
-
Average weekly wages Q1 2023: $1,185
-
Percent of population below poverty line 2022: 13.3%


Oregon
-
March 2024 unemployment rate: 4.2%
-
GDP growth Q3 2023 to Q4 2023: 4.3%
-
Average weekly wages Q1 2023: $1,301
-
Percent of population below poverty line 2022: 11.9%


Oklahoma
-
March 2024 unemployment rate: 3.5%
-
GDP growth Q3 2023 to Q4 2023: 4.1%
-
Average weekly wages Q1 2023: $1,052
-
Percent of population below poverty line 2022: 15.2%
Find Out: I’m a Financial Advisor: Here’s Why My Rich Clients Identify With the Middle Class


Tennessee
-
March 2024 unemployment rate: 3.2%
-
GDP growth Q3 2023 to Q4 2023: 4.8%
-
Average weekly wages Q1 2023: $1,199
-
Percent of population below poverty line 2022: 14


New Mexico
-
March 2024 unemployment rate: 3.8%
-
GDP growth Q3 2023 to Q4 2023: 6.1%
-
Average weekly wages Q1 2023: $1,096
-
Percent of population below poverty line 2022: 18.3%


Iowa
-
March 2024 unemployment rate: 2.9%
-
GDP growth Q3 2023 to Q4 2023: 1.1%
-
Average weekly wages Q1 2023: $1,112
-
Percent of population below poverty line 2022: 11.1%
Discover Next: Net Worth for US Families: How To Tell if You’re Poor, Middle Class, Upper Middle Class or Rich


Indiana
-
March 2024 unemployment rate: 3.5%
-
GDP growth Q4 2022 to Q1 2023: 5.0%
-
Average weekly wages Q1 2023: $1,115
-
Percent of population below poverty line 2021: 12.3%


California
-
March 2024 unemployment rate: 5.3%
-
GDP growth Q3 2023 to Q4 2023: 4.8%
-
Average weekly wages Q1 2023: $1,613
-
Percent of population below poverty line 2022: 12.1%


States Whose Economies Are Thriving
If you live in one of these states, you’ve probably noticed the signs of economic improvement. Unemployment and GDP levels are recovering nicely in these areas. Here’s a look at the 15 states that are seeing the strongest signs of economic stability.
Trending Now: Toilet Paper to Discontinued Items: 7 Ways Shrinkflation Has Come to Costco


Utah
-
March 2024 unemployment rate: 2.8%
-
GDP growth Q3 2023 to Q4 2023: 6.7%
-
Average weekly wages Q1 2023: $1,195
-
Percent of population below poverty line 2022: 8.5%


Idaho
-
March 2024 unemployment rate: 3.3%
-
GDP growth Q3 2023 to Q4 2023: 7.7%
-
Average weekly wages Q1 2023: $1,068
-
Percent of population below poverty line 2022: 11%


District of Columbia
-
March 2024 unemployment rate: 5.2%
-
GDP growth Q3 2023 to Q4 2023: 3.8%
-
Average weekly wages Q1 2023: $2,159
-
Percent of population below poverty line 2022: 15.1%
For You: A $150K Income Is ‘Lower Middle Class’ In These High-Cost Cities


Virginia
-
March 2024 unemployment rate: 2.9%
-
GDP growth Q3 2023 to Q4 2023: 5.5%
-
Average weekly wages Q1 2023: $1,383
-
Percent of population below poverty line 2022: 10%


Colorado
-
March 2024 unemployment rate: 3.7%
-
GDP growth Q3 2023 to Q4 2023: 5.1%
-
Average weekly wages Q1 2023: $1,431
-
Percent of population below poverty line 2022: 9.6%


Washington
-
March 2024 unemployment rate: 4.8%
-
GDP growth Q3 2023 to Q4 2023: 5.9%
-
Average weekly wages Q1 2023: $1,682
-
Percent of population below poverty line 2022: 9.9%
Be Aware: 6 Rare Coins That Will Spike in Value in 2024


Alaska
-
March 2024 unemployment rate: 4.6%
-
GDP growth Q3 2023 to Q4 2023: 6.3%
-
Average weekly wages Q1 2023: $1,328
-
Percent of population below poverty line 2022: 10.5%


Arizona
-
March 2024 unemployment rate: 3.8%
-
GDP growth Q3 2023 to Q4 2023: 6.8%
-
Average weekly wages Q1 2023: $1,248
-
Percent of population below poverty line 2022: 13.1%


New Hampshire
-
March 2024 unemployment rate: 2.6%
-
GDP growth Q3 2023 to Q4 2023: 5.6%
-
Average weekly wages Q1 2023: $1,350
-
Percent of population below poverty line 2022: 7.3%
Try This:


Wyoming
-
March 2024 unemployment rate: 2.8%
-
GDP growth Q3 2023 to Q4 2023: 3.7%
-
Average weekly wages Q1 2023: $1,111
-
Percent of population below poverty line 2022: 10.7%


Massachusetts
-
March 2024 unemployment rate: 2.9%
-
GDP growth Q3 2023 to Q4 2023: 5.0%
-
Average weekly wages Q1 2023: $1,643
-
Percent of population below poverty line 2022: 9.9%


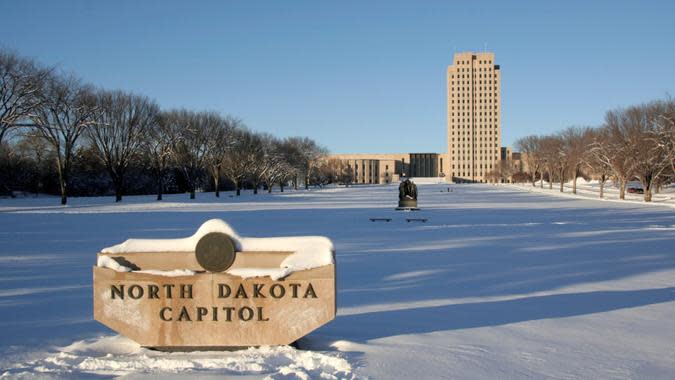
North Dakota
-
March 2024 unemployment rate: 2.0%
-
GDP growth Q3 2023 to Q4 2023: 2.0%
-
Average weekly wages Q1 2023: $1,205
-
Percent of population below poverty line 2022: 10.8%
Read Next:


South Carolina
-
March 2024 unemployment rate: 3.1%
-
GDP growth Q3 2023 to Q4 2023: 6.8%
-
Average weekly wages Q1 2023: $1,086
-
Percent of population below poverty line 2022: 14.4%


Maine
-
March 2024 unemployment rate: 3.3%
-
GDP growth Q3 2023 to Q4 2023: 5.9%
-
Average weekly wages Q1 2023: $1,129
-
Percent of population below poverty line 2022: 10.9%


Florida
-
March 2024 unemployment rate: 3.2%
-
GDP growth Q3 2023 to Q4 2023: 7.0%
-
Average weekly wages Q1 2023: $1,218
-
Percent of population below poverty line 2022: 12.9%
John Csiszar contributed to the reporting of this article.
Methodology: GOBankingRates analyzed the following seven factors for each state and the District of Columbia to gauge the health of their economies: (1) the March 2024 unemployment rate according to the Bureau of Labor Statistics’ (BLS) Local Area Unemployment Statistics data; (2) the year-over-year change in non-farm payroll jobs as of March 2024 according to the BLS’s State and Metro Area Employment, Hours and Earnings data; (3) the Q4 2023 GDP per capita in current dollars, calculated by using population data from the Census Bureau’s American Community Survey (ACS) 2022 estimates and the Bureau of Economic Analysis’s (BEA) most recent GDP by State release; (4) the percent by which GDP grew between the third quarter of 2023 and the fourth quarter of 2023, also according to the BEA’s GDP release; (5) the average weekly wage in Q3 2023 according to the BLS’s Economic News Release; (6) the percent change in the average weekly wage between Q3 2022 and Q3 2023, also according to the BLS Economic News Release; and (7) the percent of the population that was living below the poverty line in 2022, according to the Census Bureau’s 2022 ACS 5-year data. States were scored on all factors and ranked against each other based on their combined total score. The states with the lowest combined scores were identified as states with thriving economies and the states with the highest combined scores were identified as states with failing economies. All data was collected on and up to date as of May 1, 2024.
More From GOBankingRates
This article originally appeared on GOBankingRates.com: States Whose Economies Are Failing vs. States Whose Economies Are Thriving
Source Agencies


