
Where you retire can have a big impact on your financial standing, given the variability of living costs, average income in retirement and overall economic climate in different cities across the U.S.
For You: Retirement Planning: Here’s How Much Money You Actually Need To Age in Place
Try This: How To Get $340 Per Year in Cash Back on Gas and Other Things You Already Buy
To determine the cities with the most financially secure seniors, MutualFund.com analyzed 170 U.S. cities with populations exceeding 150,000 based on variables including senior poverty rates, homeownership rates, mortgage status, reliance on food stamps, private retirement income and household earnings.
Based on that analysis, these are the U.S. cities with the most financially secure seniors.
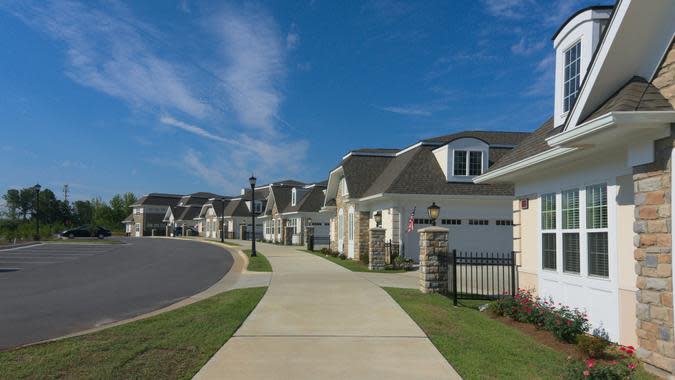
1. Cary, North Carolina
-
Senior poverty rate: 7.2%
-
Percent of senior homeowners: 77.4%
-
Percent of seniors on food stamps: 2.7%
-
Average household retirement income: $40,571
Be Aware: Retirement 2024: These Are the 7 Worst Places To Retire in South Carolina
Good To Know: Retirement Spending: 9 Things Even Spendthrifts Don’t Waste Money On

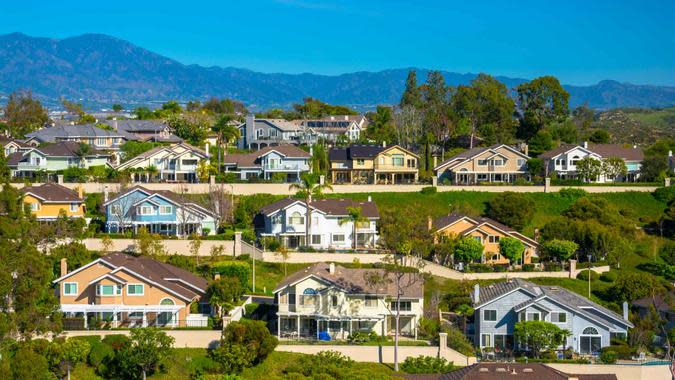
2. Huntington Beach, California
-
Senior poverty rate: 8.1%
-
Percent of senior homeowners: 76.6%
-
Percent of seniors on food stamps: 4.5%
-
Average household retirement income: $48,763
Find Out: 10 Things Boomers Should Always Buy in Retirement

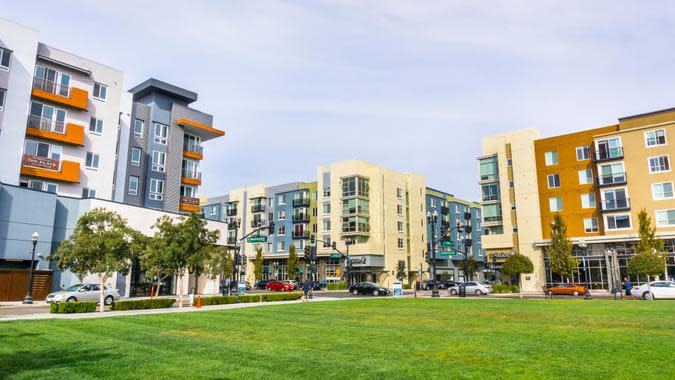
3. Fremont, California
-
Senior poverty rate: 6.8%
-
Percent of senior homeowners: 79.1%
-
Percent of seniors on food stamps: 4.3%
-
Average household retirement income: $46,263
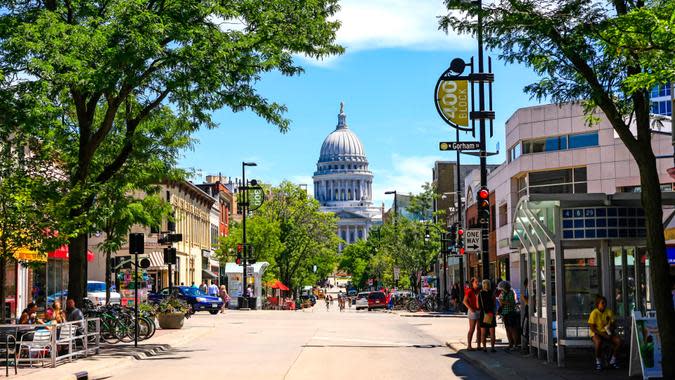
4. Madison, Wisconsin
-
Senior poverty rate: 7.2%
-
Percent of senior homeowners: 73.6%
-
Percent of seniors on food stamps: 7.5%
-
Average household retirement income: $44,736
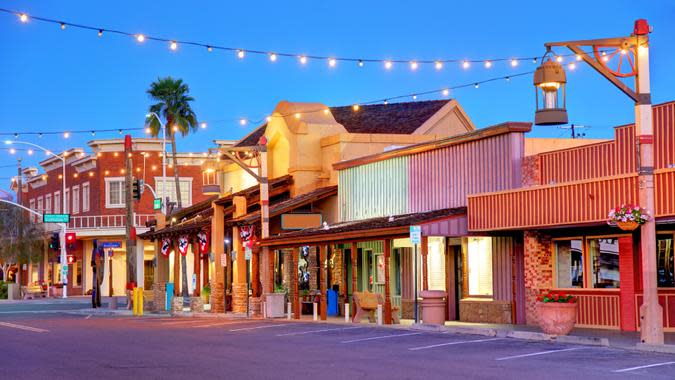
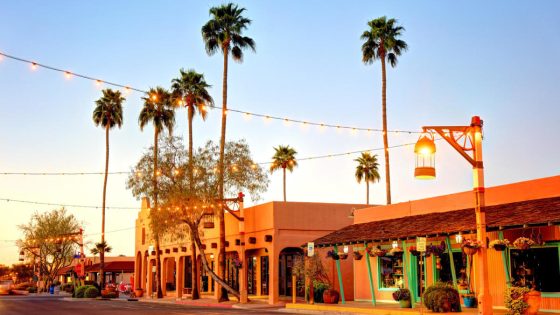
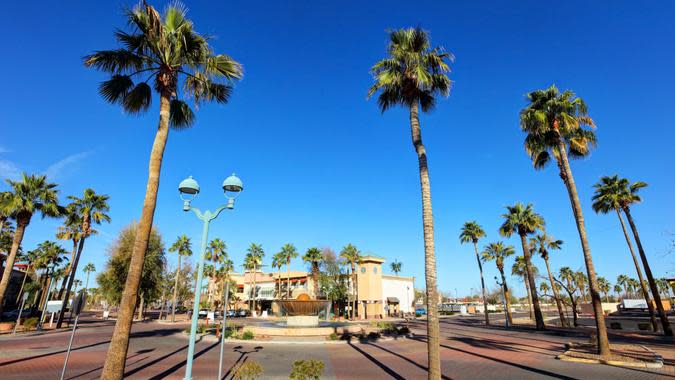
5. Scottsdale, Arizona
-
Senior poverty rate: 9.8%
-
Percent of senior homeowners: 81.2%
-
Percent of seniors on food stamps: 2.1%
-
Average household retirement income: $45,771

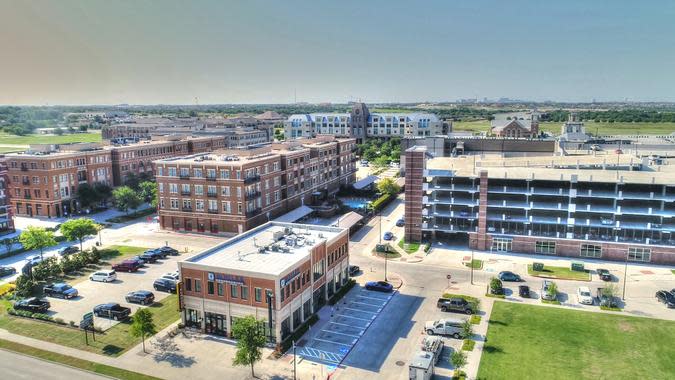
6. Plano, Texas
-
Senior poverty rate: 7.3%
-
Percent of senior homeowners: 72.6%
-
Percent of seniors on food stamps: 2.5%
-
Average household retirement income: $38,150
Trending Now: Passive Income Experts: 4 Passive Income Opportunities for Retirees To Generate Wealth

7. Huntsville, Alabama
-
Senior poverty rate: 9.0%
-
Percent of senior homeowners: 81.4%
-
Percent of seniors on food stamps: 7.5%
-
Average household retirement income: $38,788
8. Sunnyvale, California
-
Senior poverty rate: 8.1%
-
Percent of senior homeowners: 75.6%
-
Percent of seniors on food stamps: 4.5%
-
Average household retirement income: $41,169
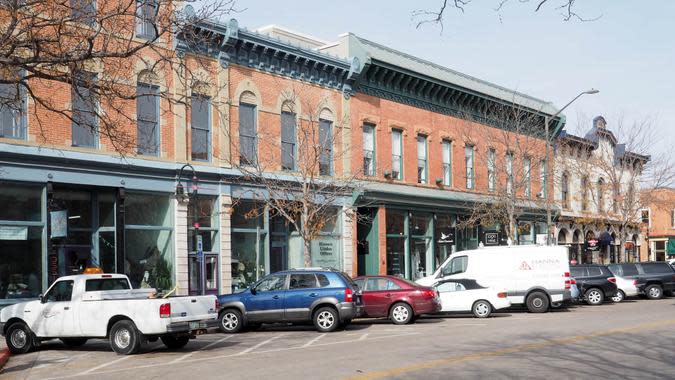
9. Fort Collins, Colorado
-
Senior poverty rate: 8.4%
-
Percent of senior homeowners: 78.3%
-
Percent of seniors on food stamps: 5.6%
-
Average household retirement income: $43,967

10. Chesapeake, Virginia
-
Senior poverty rate: 6.3%
-
Percent of senior homeowners: 82.1%
-
Percent of seniors on food stamps: 5.5%
-
Average household retirement income: $38,267
Read Next: Suze Orman: Why Even Big Retirement Savers Are at Risk

11. Alexandria, Virginia
-
Senior poverty rate: 6.7%
-
Percent of senior homeowners: 63.8%
-
Percent of seniors on food stamps: 6.1%
-
Average household retirement income: $66,953

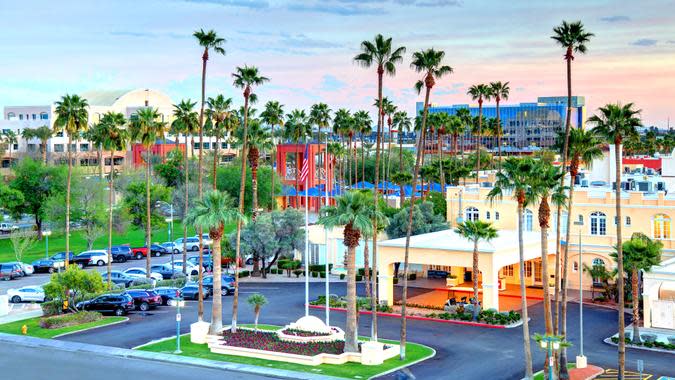
12. Tempe, Arizona
-
Senior poverty rate: 7.0%
-
Percent of senior homeowners: 76.1%
-
Percent of seniors on food stamps: 4.5%
-
Average household retirement income: $37,776

13. Anchorage, Alaska
-
Senior poverty rate: 9.9%
-
Percent of senior homeowners: 80.9%
-
Percent of seniors on food stamps: 7.4%
-
Average household retirement income: $52,406

14. Rancho Cucamonga, California
-
Senior poverty rate: 6.1%
-
Percent of senior homeowners: 77.3%
-
Percent of seniors on food stamps: 7.2%
-
Average household retirement income: $41,532
Explore More: 16 Best Places To Retire in the US That Feel Like Europe
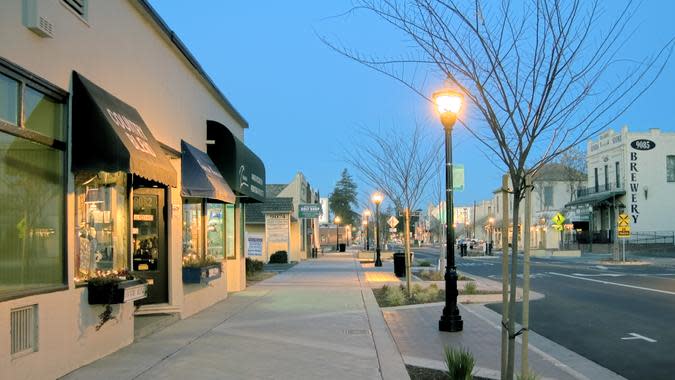
15. Elk Grove, California
-
Senior poverty rate: 7.1%
-
Percent of senior homeowners: 80.9%
-
Percent of seniors on food stamps: 5.0%
-
Average household retirement income: $47,244

16. Colorado Springs, Colorado
-
Senior poverty rate: 6.2%
-
Percent of senior homeowners: 76.9%
-
Percent of seniors on food stamps: 6.7%
-
Average household retirement income: $41,394
17. Gilbert, Arizona
-
Senior poverty rate: 6.0%
-
Percent of senior homeowners: 85.0%
-
Percent of seniors on food stamps: 3.2%
-
Average household retirement income: $34,627

18. Peoria, Arizona
-
Senior poverty rate: 6.7%
-
Percent of senior homeowners: 80.8%
-
Percent of seniors on food stamps: 3.3%
-
Average household retirement income: $33,076
Be Aware: Retirement 2024: These Are the 10 Worst Places To Retire in North Carolina
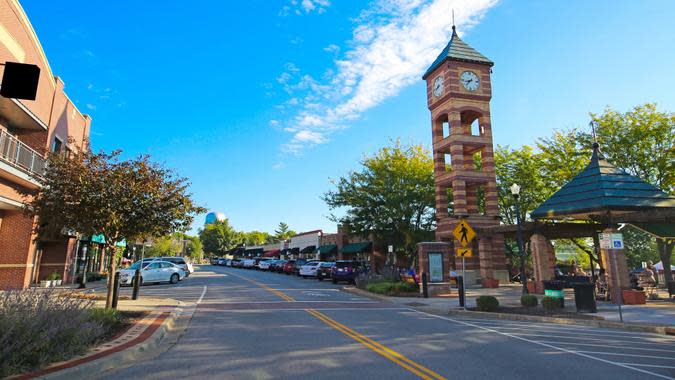
19. Overland Park, Kansas
-
Senior poverty rate: 5.9%
-
Percent of senior homeowners: 71.0%
-
Percent of seniors on food stamps: 1.0%
-
Average household retirement income: $34,655
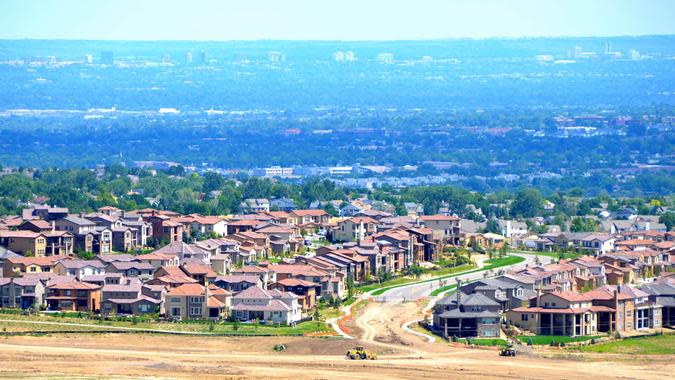
20. Lakewood, Colorado
-
Senior poverty rate: 5.6%
-
Percent of senior homeowners: 74.1%
-
Percent of seniors on food stamps: 4.9%
-
Average household retirement income: $41,640
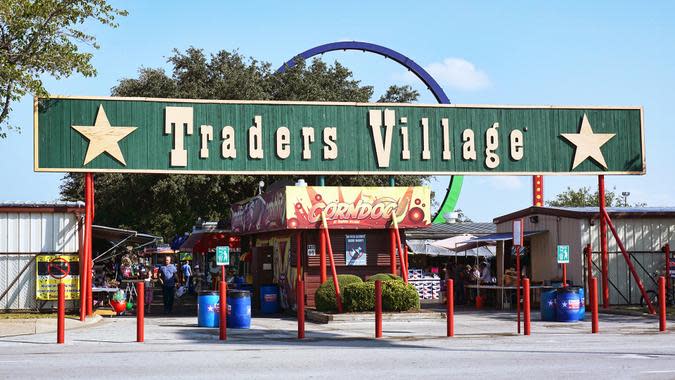
21. Grand Prairie, Texas
-
Senior poverty rate: 6.3%
-
Percent of senior homeowners: 74.4%
-
Percent of seniors on food stamps: 6.4%
-
Average household retirement income: $29,876
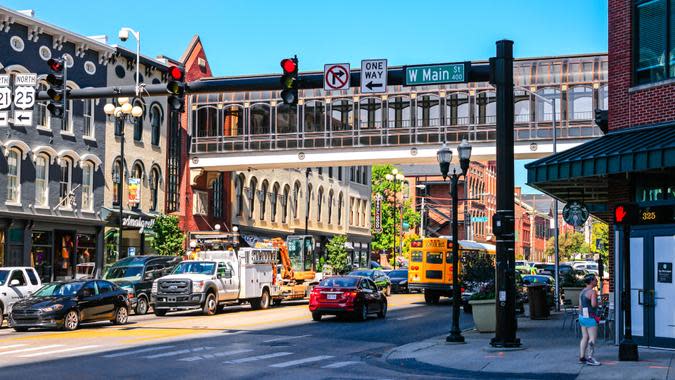
22. Lexington, Kentucky
-
Senior poverty rate: 7.3%
-
Percent of senior homeowners: 75.8%
-
Percent of seniors on food stamps: 5.3%
-
Average household retirement income: $38,804
For You: 4 Things Boomers Should Never Sell in Retirement

23. Boise, Idaho
-
Senior poverty rate: 7.7%
-
Percent of senior homeowners: 76.8%
-
Percent of seniors on food stamps: 4.9%
-
Average household retirement income: $32,697
24. Irvine, California
-
Senior poverty rate: 7.9%
-
Percent of senior homeowners: 69.4%
-
Percent of seniors on food stamps: 4.6%
-
Average household retirement income: $48,223
25. Frisco, Texas
-
Senior poverty rate: 7.0%
-
Percent of senior homeowners: 72.6%
-
Percent of seniors on food stamps: 2.4%
-
Average household retirement income: $39,046

26. Little Rock, Arkansas
-
Senior poverty rate: 8.0%
-
Percent of senior homeowners: 77.0%
-
Percent of seniors on food stamps: 6.6%
-
Average household retirement income: $36,557
Find Out: I’m a Baby Boomer Who Had To Un-Retire: 3 Money Lessons I Wish I’d Known
27. Chandler, Arizona
-
Senior poverty rate: 7.6%
-
Percent of senior homeowners: 81.2%
-
Percent of seniors on food stamps: 2.7%
-
Average household retirement income: $33,372

28. Virginia Beach, Virginia
-
Senior poverty rate: 8.8%
-
Percent of senior homeowners: 80.8%
-
Percent of seniors on food stamps: 4.3%
-
Average household retirement income: $41,131
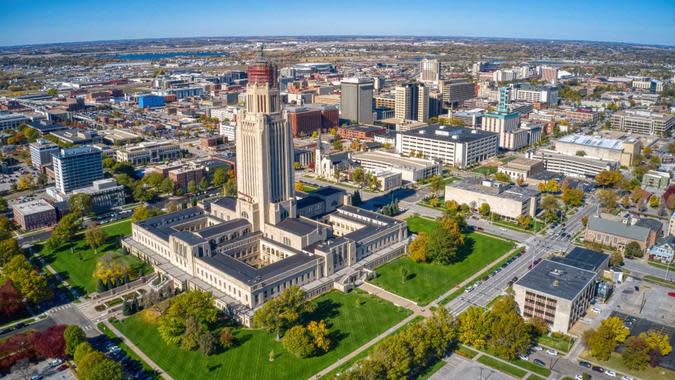
29. Lincoln, Nebraska
-
Senior poverty rate: 9.3%
-
Percent of senior homeowners: 74.7%
-
Percent of seniors on food stamps: 6.6%
-
Average household retirement income: $33,200
30. Clarksville, Tennessee
-
Senior poverty rate: 7.0%
-
Percent of senior homeowners: 75.8%
-
Percent of seniors on food stamps: 6.5%
-
Average household retirement income: $27,634
Data is sourced from MutualFund.com and is accurate as of May 9, 2024.
More From GOBankingRates
This article originally appeared on GOBankingRates.com: 30 Cities With the Most Financially Secure Seniors
Source Agencies